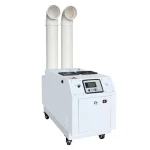
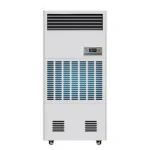
A loading door opens at a warehouse. Warm, humid air enters, and water starts forming on a cold pipe, even though the room temperature looks normal. What changed? A psychrometric chart can help answer that question without guessing from relative humidity (RH) alone.
A psychrometric chart brings temperature and moisture information into one picture. It helps you understand how air conditions change during heating, cooling, and dehumidification, and why condensation can occur even when room humidity readings seem acceptable.
In this guide, you’ll learn how to read a psychrometric chart step by step, understand common air-treatment processes, and use practical examples to assess condensation risk and estimate moisture removal. No advanced HVAC knowledge is required to follow the basics.

What Does a Psychrometric Chart Tell You?
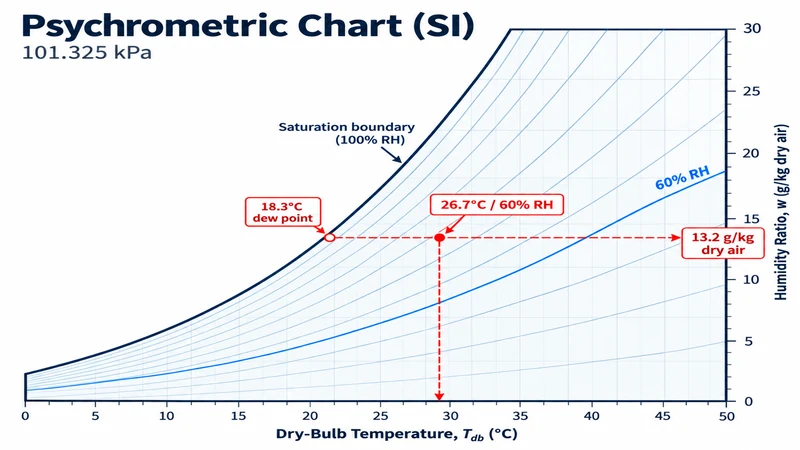
A psychrometric chart describes moist air at a specified atmospheric pressure. On the chart used here, temperature runs from left to right, and the amount of water vapor in the air increases upward. The curved top edge marks 100% RH, when the air is saturated.
You only need four ideas to start reading it:
| Term | Plain-language meaning | Why it matters |
|---|---|---|
| Dry-bulb temperature | The ordinary air temperature | Where you start on the chart |
| Relative humidity (RH) | How close air is to saturation at that temperature | Helps locate the measured air condition |
| Humidity ratio (W) | Grams of water vapor per kilogram of dry air | Lets you compare actual moisture content |
| Dew point | Temperature at which that air would become saturated if cooled without changing its moisture content | Helps identify condensation risk |
Some charts also show wet-bulb temperature, enthalpy (the energy carried by moist air), and specific volume. These matter in advanced calculations, but you do not need to master them to make a first reading. For more on why RH and actual moisture content are not interchangeable, see how relative humidity changes with temperature. The underlying definitions are covered in ASHRAE’s psychrometric reference.
How to Read a Psychrometric Chart in Four Steps
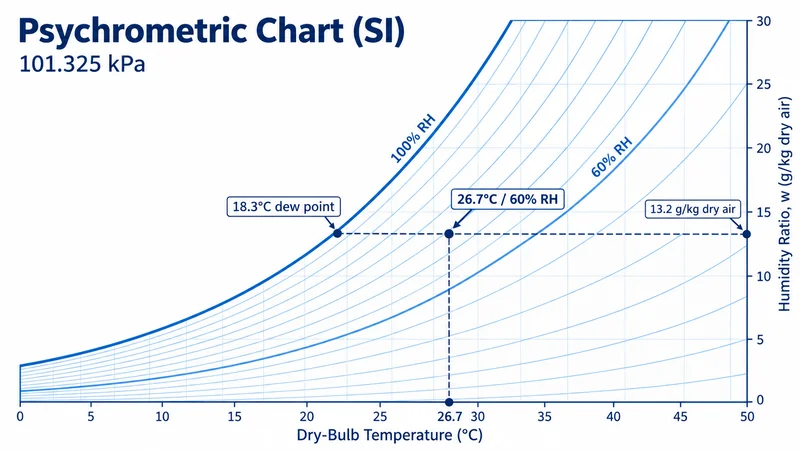
Step 1: Check the units and pressure. Many charts assume 101.325 kPa, roughly sea-level pressure. At higher elevations, use the appropriate pressure or a calculator that accepts it. Make sure you know whether the temperature is in °C or °F and whether moisture content is shown in g/kg or another unit.
Step 2: Find the air temperature. Suppose the warehouse sensor reads 26.7°C. Find that temperature along the bottom of the chart and trace upward along its temperature line.
Step 3: Find the RH curve. If the same sensor reads 60% RH, follow the 60% curve until it crosses the temperature line. The intersection is your air-condition point.
Step 4: Read the moisture and dew point. From that point, move horizontally to the humidity-ratio scale. At the stated pressure, the air contains approximately 13.2 g of water vapor per kilogram of dry air. Move horizontally left to the saturation boundary to find a dew point of approximately 18.3°C. This does not mean the room has cooled to 18.3°C; it tells you when that air would reach saturation if cooled.
Now you can ask a useful question: is any nearby surface colder than 18.3°C? If a pipe is at 16°C and the measured air reaches it, condensation is possible. For setting actual control targets, surface measurements and operating changes also matter, as explained in why dew point matters near cold industrial surfaces.
What Happens When Air Is Heated, Cooled, or Dried?
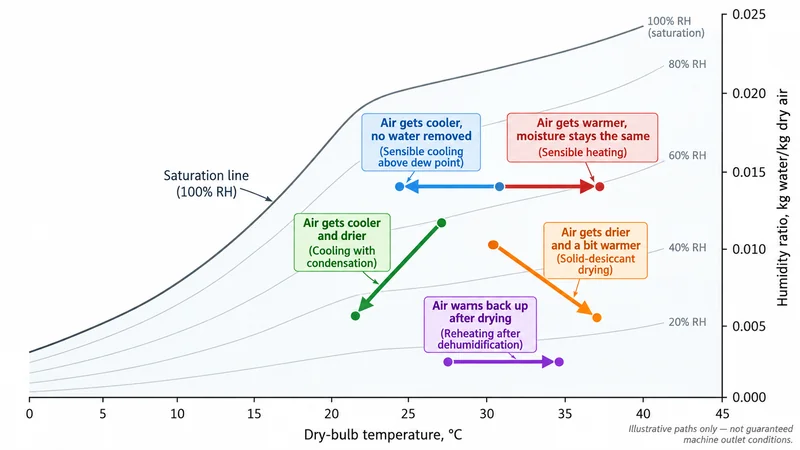
The chart becomes more useful when you compare two points. If the air gets warmer but no water is added or removed, its point moves right without moving up or down. RH usually falls, but the amount of water vapor stays the same. Cooling air above its dew point does the opposite: it moves left without removing moisture.
To actually remove water with a cooling coil, the air must be cooled enough for condensation to occur. Its chart position then moves down as the humidity ratio falls. A refrigerant dehumidifier may warm the treated air again before discharging it, so warmer outlet air can still be drier air. A desiccant dehumidifier, which uses a moisture-absorbing material, often produces air that is both drier and warmer. Its path generally moves down and right.
This is why equipment inlet and outlet temperatures alone cannot confirm how much moisture has been removed. Their humidity ratios—and the airflow through the equipment—matter too. Choosing between technologies is a different question, discussed in how refrigerant and desiccant dehumidifiers differ in operation.
Warehouse Example: Why a Pipe Can Sweat at 58% RH
Imagine a warehouse at 24°C and 50% RH. Outside air enters through a loading door at 32°C and 75% RH. For a simple example, assume the air mixing near the door consists of 80% warehouse air and 20% incoming air, measured by dry-air mass. Assume no additional heating, cooling or condensation while the two streams mix.
| Condition | Temperature | RH | Humidity ratio | Dew point |
|---|---|---|---|---|
| Warehouse air | 24°C | 50% | 9.3 g/kg | 12.9°C |
| Incoming air | 32°C | 75% | 22.7 g/kg | 27.0°C |
| Calculated mixture | 25.6°C | 58% | 12.0 g/kg | 16.8°C |
Notice what happened. The mixed air is only slightly warmer, and its RH is still below 60%. But its dew point has risen from 12.9°C to 16.8°C. If a nearby pipe is at 15°C, it was warmer than the original warehouse dew point but colder than the mixed-air dew point. Condensation can now occur where that air contacts the pipe.
The calculation uses a moisture balance and an energy balance to find the mixed condition; it is not a prediction that the entire warehouse will reach 25.6°C. The 20% incoming-air share is assumed for teaching, not measured from door-opening time. What the example demonstrates is simple: a modest RH reading can hide a meaningful change in condensation risk.
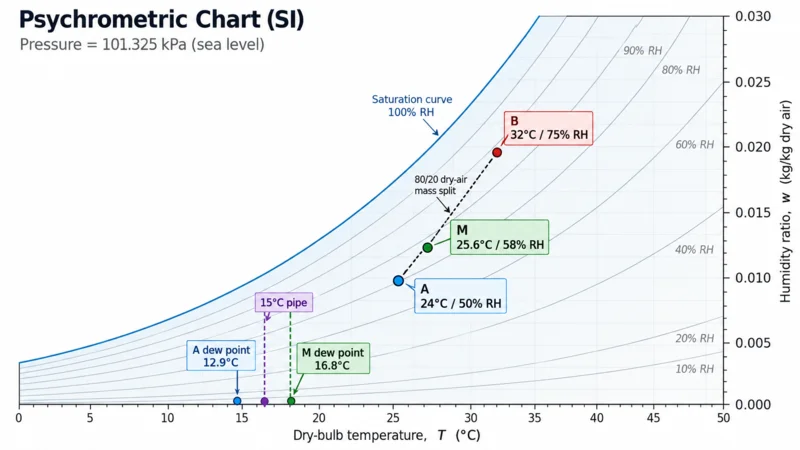
In a real facility, the next step is to measure temperature and RH near the door and the affected surface at matching times, then compare those readings with the surface temperature. Loading activity, airflow and local conditions can change the result. This chart example is not a complete warehouse moisture-control plan; that broader work belongs in an assessment of how moisture moves through warehouse operating areas.
Can the Chart Estimate How Much Water Is Removed?
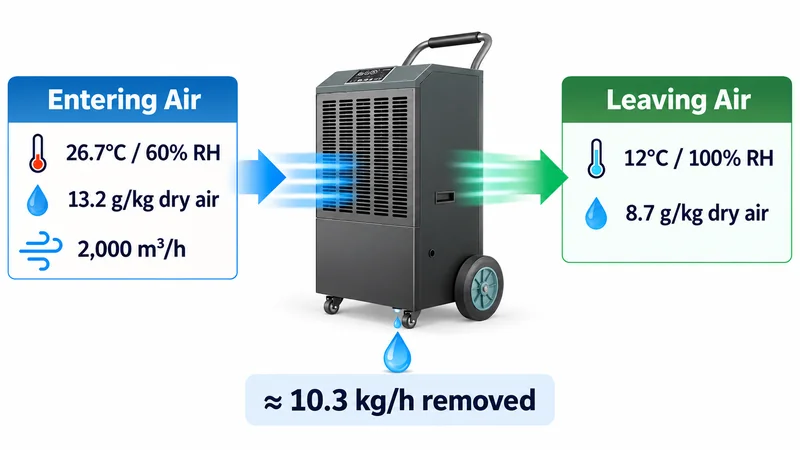
Yes, if you also know how much air is moving. The basic relationship is:
Water removed (kg/h) = dry-air flow (kg/h) × drop in humidity ratio (kg/kg dry air)
For example, consider 2,000 m³/h of air entering at 26.7°C and 60% RH. At 101.325 kPa, that is approximately 2,306 kg of dry air per hour. If it could leave at an idealized saturated condition of 12°C, its humidity ratio would fall from about 13.2 to 8.7 g/kg dry air. Using the unrounded properties gives roughly 10.3 kg/h of water removed.
That is a teaching calculation, not a machine rating. Real equipment may not reach that outlet condition, and the result says nothing by itself about the total moisture entering the building. A full project estimate also needs information about outdoor air, doors, wet materials, operating schedules and equipment performance; those questions are addressed in what goes into sizing an industrial dehumidifier.
What Should You Measure Before Using the Results?
A clear chart is only as useful as the measurements behind it. Record temperature and RH together at the locations that matter: for example, room air, outdoor air, equipment inlet and outlet, or the air beside a cold surface. Note the measurement times, door openings and operating changes. If condensation is the concern, measure the surface temperature as well; if water-removal rate is the concern, obtain airflow at a known measurement point.
Keep measured readings, calculated values and assumptions separate. You can check humidity ratio and dew point using a pressure-aware tool such as the Vaisala humidity calculator. Missing airflow or leakage data should be identified as unknown, rather than replaced by guesses.
Frequently Asked Questions
Do I need to understand every line on the chart?
No. Start with temperature, RH, humidity ratio and dew point. Other lines become useful when you need to calculate heating, cooling or airflow in more detail.
Can RH fall without any water being removed?
Yes. Heating air without removing water usually lowers its RH while leaving its humidity ratio unchanged. That is why RH alone cannot show whether a dehumidifier is removing moisture.
How does dehumidification look on the chart?
It moves toward a lower humidity ratio, usually downward on the chart used here. Cooling with condensation typically moves down and left; desiccant drying often moves down and right.
Can the chart tell me what size dehumidifier to buy?
Not by itself. It can describe air conditions and help estimate water removal for a known airflow, but facility sizing also requires moisture-load and actual equipment-performance data.
Can a building management system do these calculations?
Often yes, if it has suitable sensor readings and pressure assumptions. A plotted chart remains useful for comparing locations and making changes visible to the facility team.
Conclusion
A psychrometric chart does not have to be an intimidating engineering diagram. Start with a paired temperature and RH reading, find the humidity ratio and dew point, and compare the point with another air condition. That simple approach helps explain why warm air is not necessarily wetter, why RH can change without water removal, and why condensation can appear when a loading door opens. For equipment or facility decisions, use the chart alongside representative site measurements—not as a substitute for them.